Stock-Based Compensation: Friend or Foe?
In the border skirmish separating so-called “growth” from “value investors,” few topics spark a more heated battle than that of stock-based compensation.
Stock-based compensation (SBC) is an old idea that has become more popular over time. Simply put, SBC allows employees to own a piece of the business. It aligns incentives and encourages companies to scale faster. Rather than giving employees full compensation in cash, companies can instead hand out shares. The cash savings allows them to hire more engineers and invest heavily in sales and marketing.
Typical share compensation schemes in modern tech companies vest over four years. Companies often have employee stock purchase plans allowing employees to buy company stock at a 15 percent discount from the current market price.
When companies do well, employees who own a lot of stock can become fabulously wealthy. This bolsters the attraction of working at tech companies, increases competition and—at least in theory—allows companies to hire the best candidates.
Like any other good idea in finance however, SBC can also get overdone. Some companies spend too much in stock-based compensation, increasing the share count beyond what the company’s fundamentals can justify. In these cases, the stock price suffers.
Yet shareholders can do quite well despite dilution, as long as they are rewarded on a per share basis.
Below we’ll look at heavy issuers of SBC that have worked out well for shareholders.
But first, let's take a quick digression to understand SBC accounting.
A Real Expense
Stock-based compensation is treated by companies as a non-cash expense because it doesn’t consume cash. This is why fast-growing tech companies often report “adjusted” or “non-GAAP” earnings: they add back SBC and get to report higher earnings per share.
Yet SBC is a very real expense because shares awarded to employees in lieu of cash increase the company’s total share count, shrinking everyone’s equity ownership.
Another way of looking at company earnings is free cash flow (FCF). It’s what Warren Buffett calls “owner’s earnings,” or the money that is left to shareholders after the company invests in capital expenditures to keep the business growing.
Free cash flow is defined as cash flow from operations (how much cash the company generated) less capital expenditures. Cash flow from operations always adds back SBC since SBC is a non-cash expense.
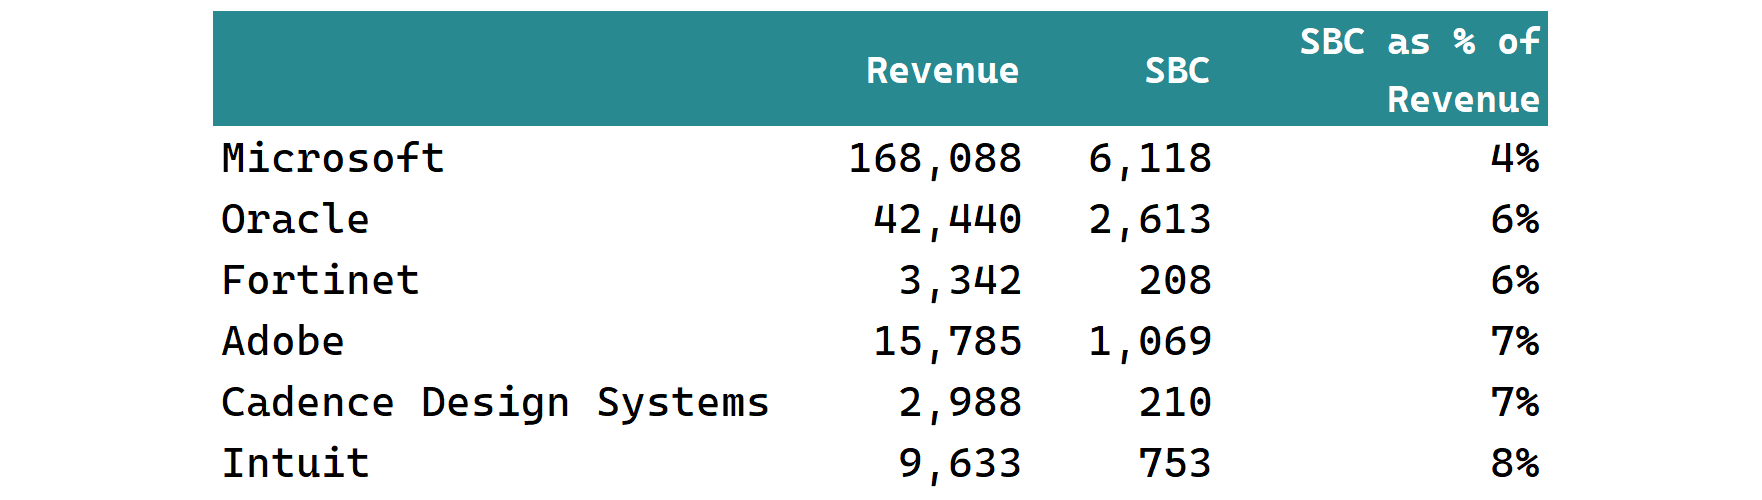
For mature, large business such as Microsoft, SBC makes a small dent on free cash flow. In the last fiscal year Microsoft generated $168 billion in sales and $56 billion in free cash flow. Just 11 percent of that free cash flow was due to SBC add-backs.
Below are some tech companies whose use of SBC represents a small percentage of revenues. Numbers are in billions of dollars:
Younger tech companies with a smaller revenue base must compete for talent and spend money on sales and marketing. For them, SBC can be a much bigger percentage of revenue.
Snowflake, for instance, paid employees half of its revenues last year as SBC:
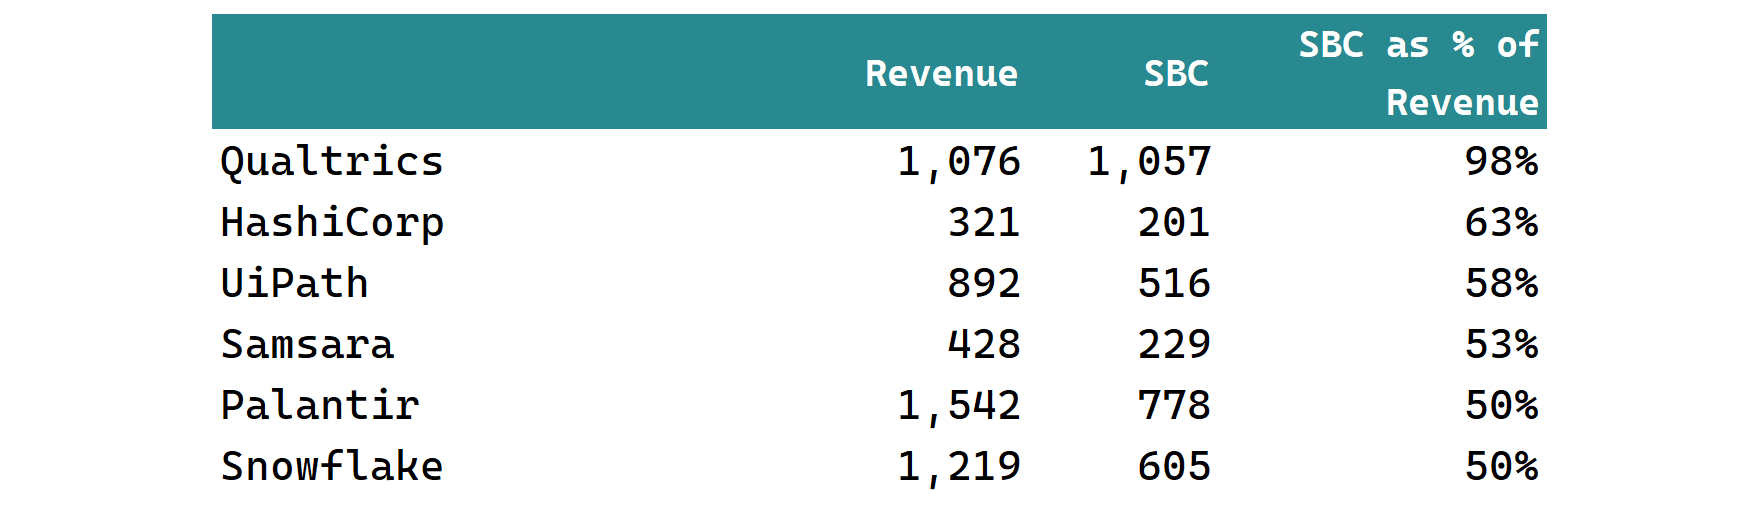
Snowflake generated $94 million in free cash flow last year after adding back $605 million in stock-based compensation. This makes its free cash flows a lot more suspect than Microsoft’s.
Real-Life Examples
Markets are wildly irrational over short periods of time, but over longer periods are quite efficient. We should therefore expect companies with SBC policies that don’t benefit shareholders not to succeed.
Let’s look at two companies that, despite being heavy users of SBC, have been successful in the stock market over many years. Salesforce’s IPO was on June 23, 2004, and ServiceNow went public on July 12, 2012. Eighteen and ten years should be enough time for markets to decide if SBC is working out or not.
Salesforce
Let’s inspect Salesforce’s cash flow statement to understand how SBC add-backs work:
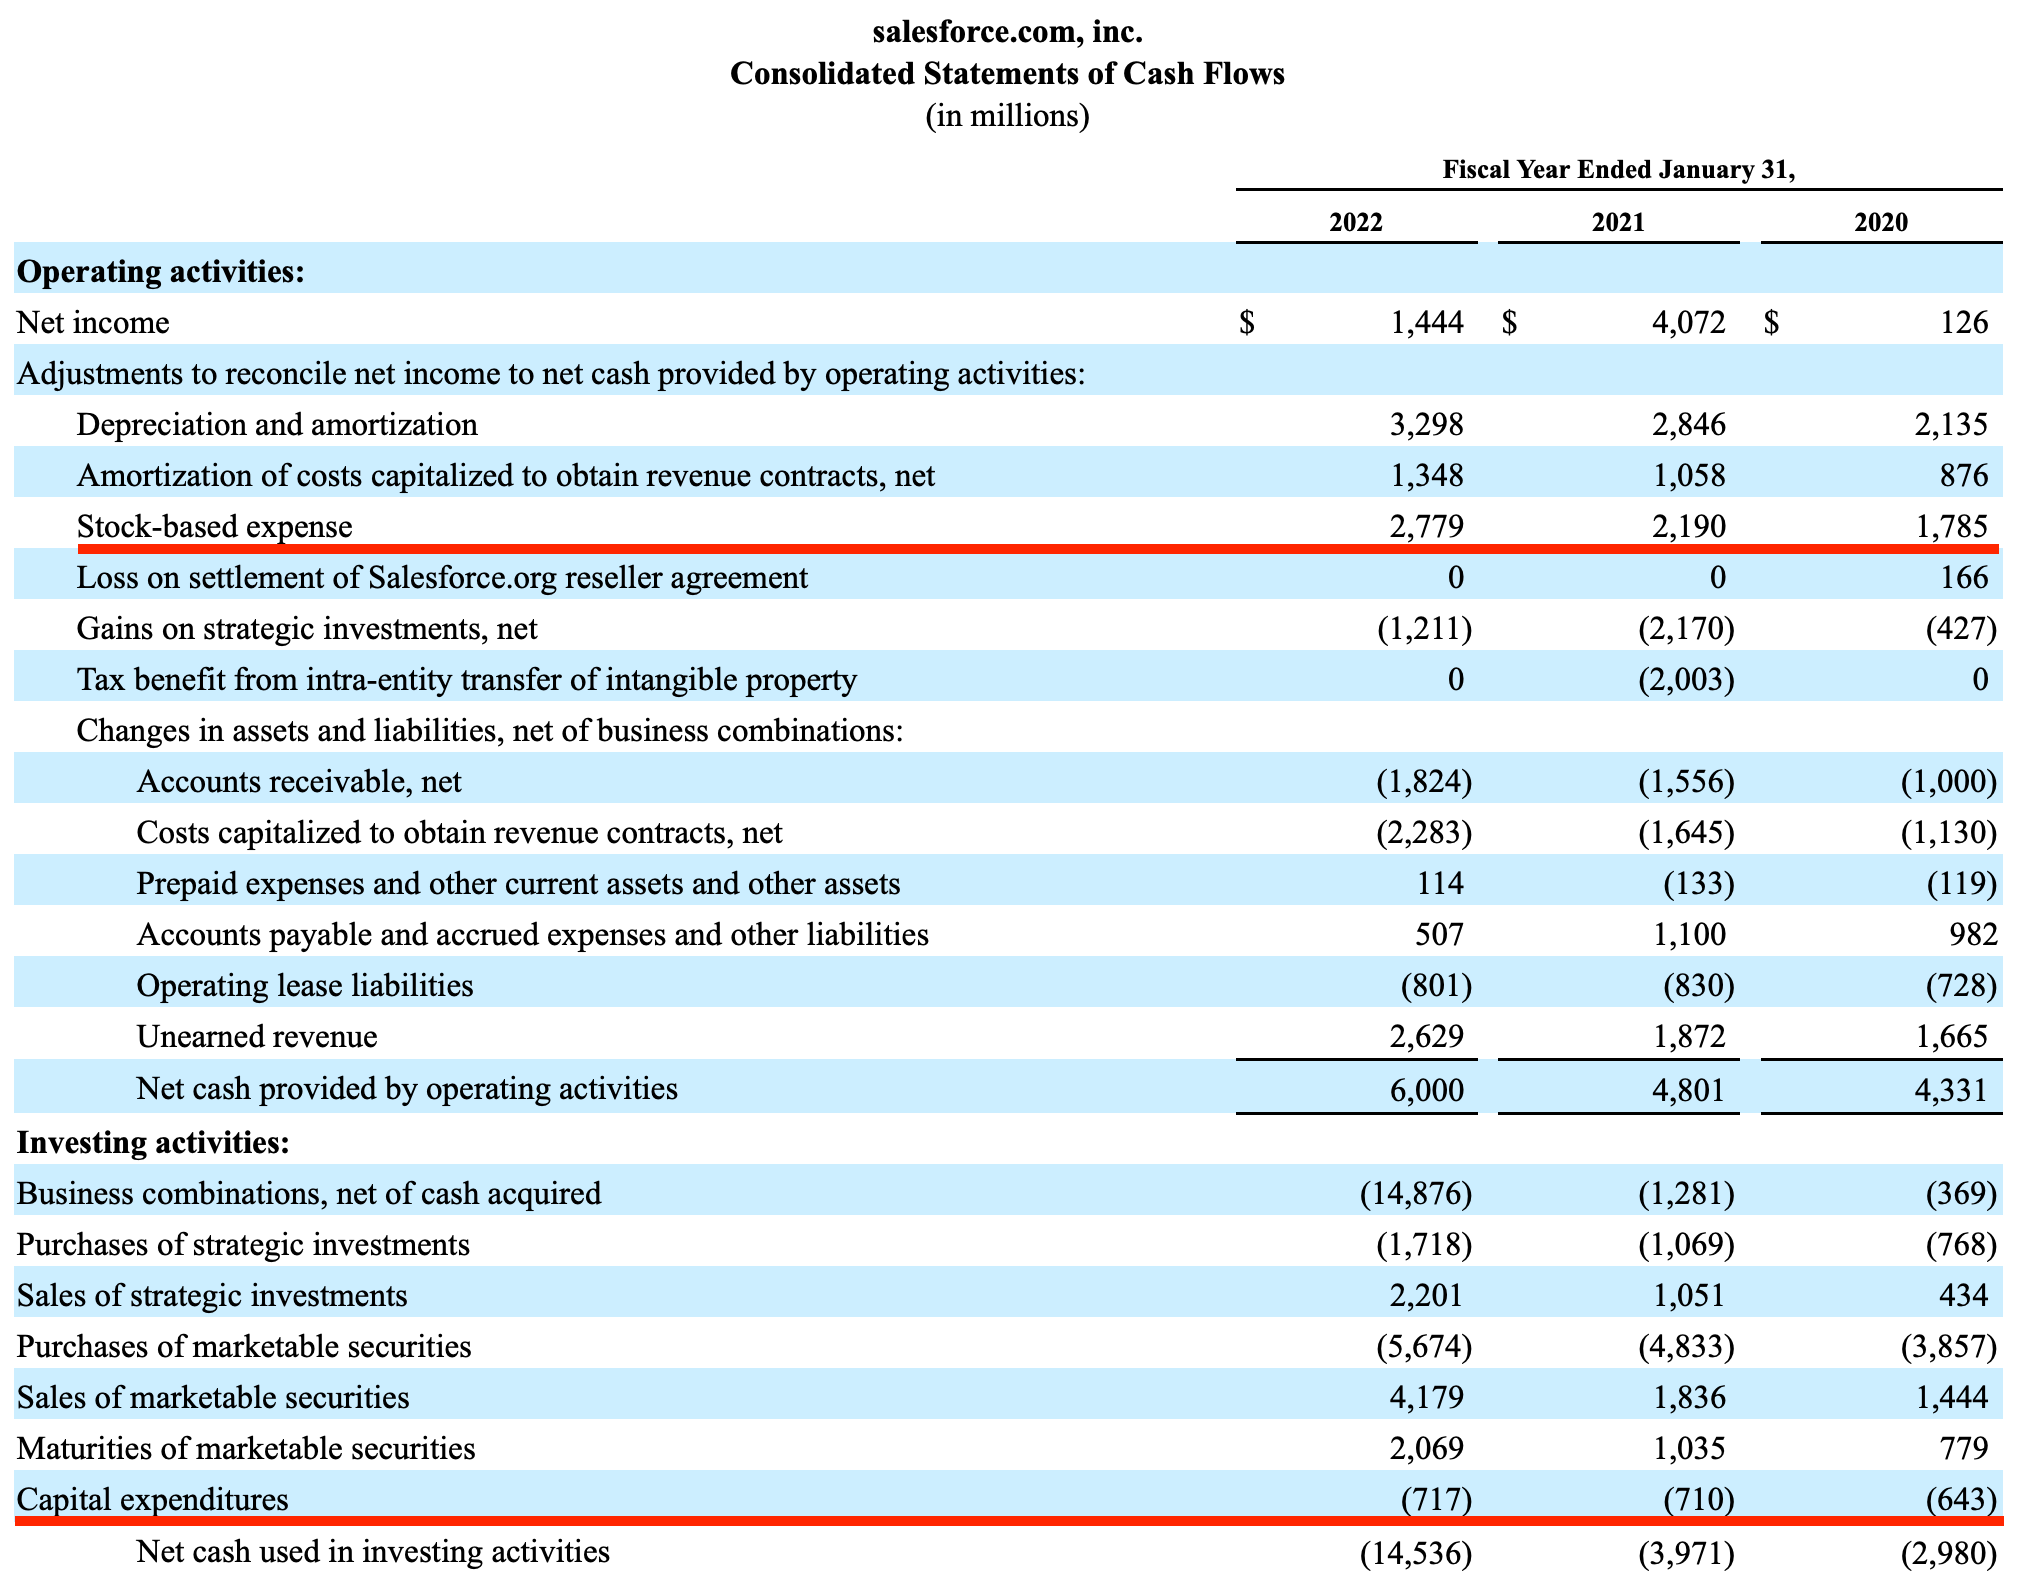
In the last fiscal year, Salesforce generated $6 billion in cash flow from operations, but $2.8 billion of that was SBC add-back. Salesforce’s capital expenditures are minimal, as expected from a software company, so free cash flow (CFO less capex) is $5.3 billion.
SBC is therefore 46 percent of Salesforce’s cash flow from operations and 53 percent of its free cash flows. Salesforce’s median quarterly SBC as a percentage of free cash flow all the way back to 2004 is 46 percent.
All this stock-based compensation has resulted in significant dilution. Since its IPO, Salesforce has diluted shareholders at a rate of 5 percent compounded, every year.
In a vacuum, these metrics don’t look promising. Imagine being told to invest in a company that dilutes its shareholders by 5 percent every year, and whose free cash flow is of such low quality, half of it is SBC add-backs.
Yet Salesforce has rewarded shareholders handsomely, and its stock has traded at high multiples free cash flow. If investors perceived Salesforce’s dilution to be excessive, and its free cash flow of poor quality, we would expect the opposite: lousy shareholder returns and low multiples of free cash flow.
Narrative Violation
Below is a chart showing Salesforce’s price to free cash flow ratios going back to its IPO.
I took Salesforce’s quarterly financials as far back as I could find them and calculated the trailing twelve month (TTM) free cash flow, defined simply as cash flow from operations less capital expenditures. This includes stock-based compensation added back to cash flow from operations.
Then I took the highest and lowest stock price during each quarter and calculated the price to TTM free cash flow. These are the bands you see swinging up and down in the images below: high P/FCF and low P/FCF.
The ratios have fluctuated wildly, from a low of 14x FCF during the Great Financial Crisis to a high of 86x in 2016 (the portion that’s off the charts was due to a particularly low free cash flow year, after Salesforce spent $300 million on land to build a new headquarters in San Francisco).
The median high and low multiples throughout this entire period are shown in the dotted lines; a median low of 39x FCF and a median high of 48x.
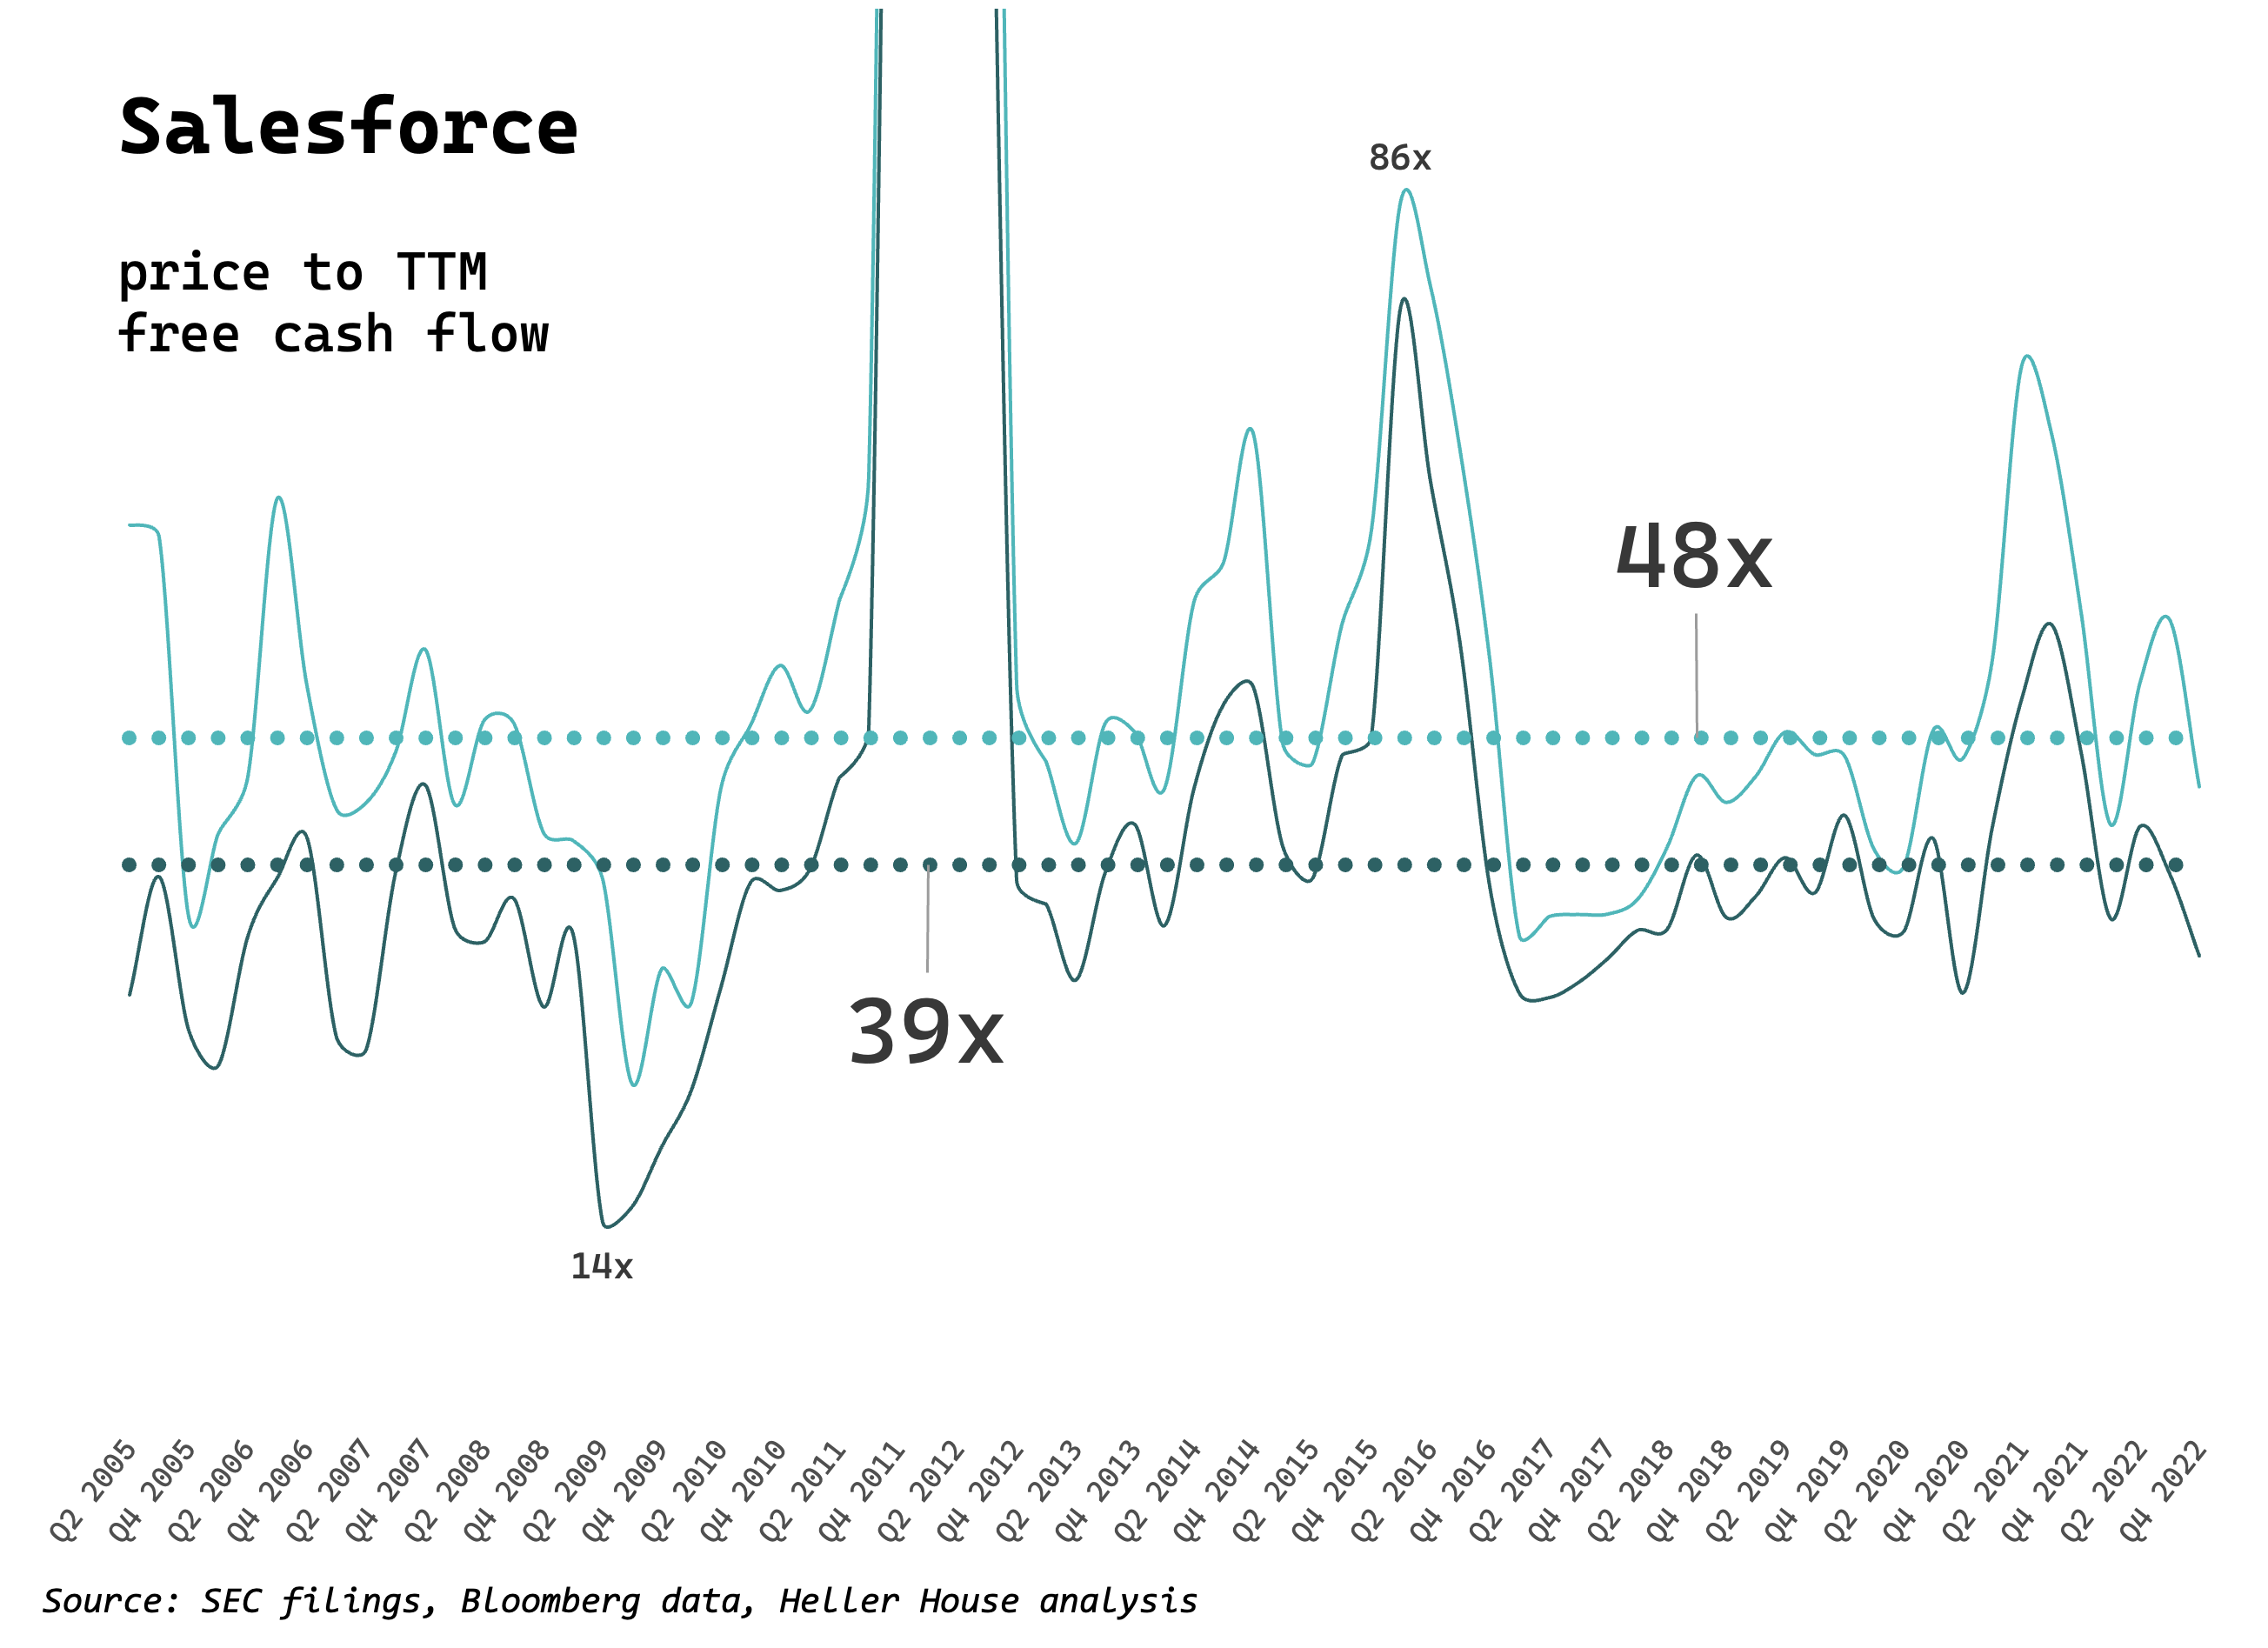
These are high multiples, certainly higher than the market average (the S&P 500 currently trades at 21x free cash flow, according to Bloomberg).
There are two reasons why Salesforce’s multiple might be high: the company has high returns on invested capital (ROIC) and grows faster than average. Indeed, Salesforce has grown revenues briskly, and over 20 percent every year in recent years, more than twice what’s expected from S&P 500 companies this year.
It’s harder to determine Salesforce’s ROIC because the company has made so many acquisitions, but if we measure the company’s free cash flows against its depreciated property, plant and equipment (PP&E), its returns on tangible capital are extremely high (on the order of 100 percent).
Despite what many analysts would consider excessive dilution and poor quality of earnings (since SBC is such a consistently high proportion of free cash flows), Salesforce stock has performed well.
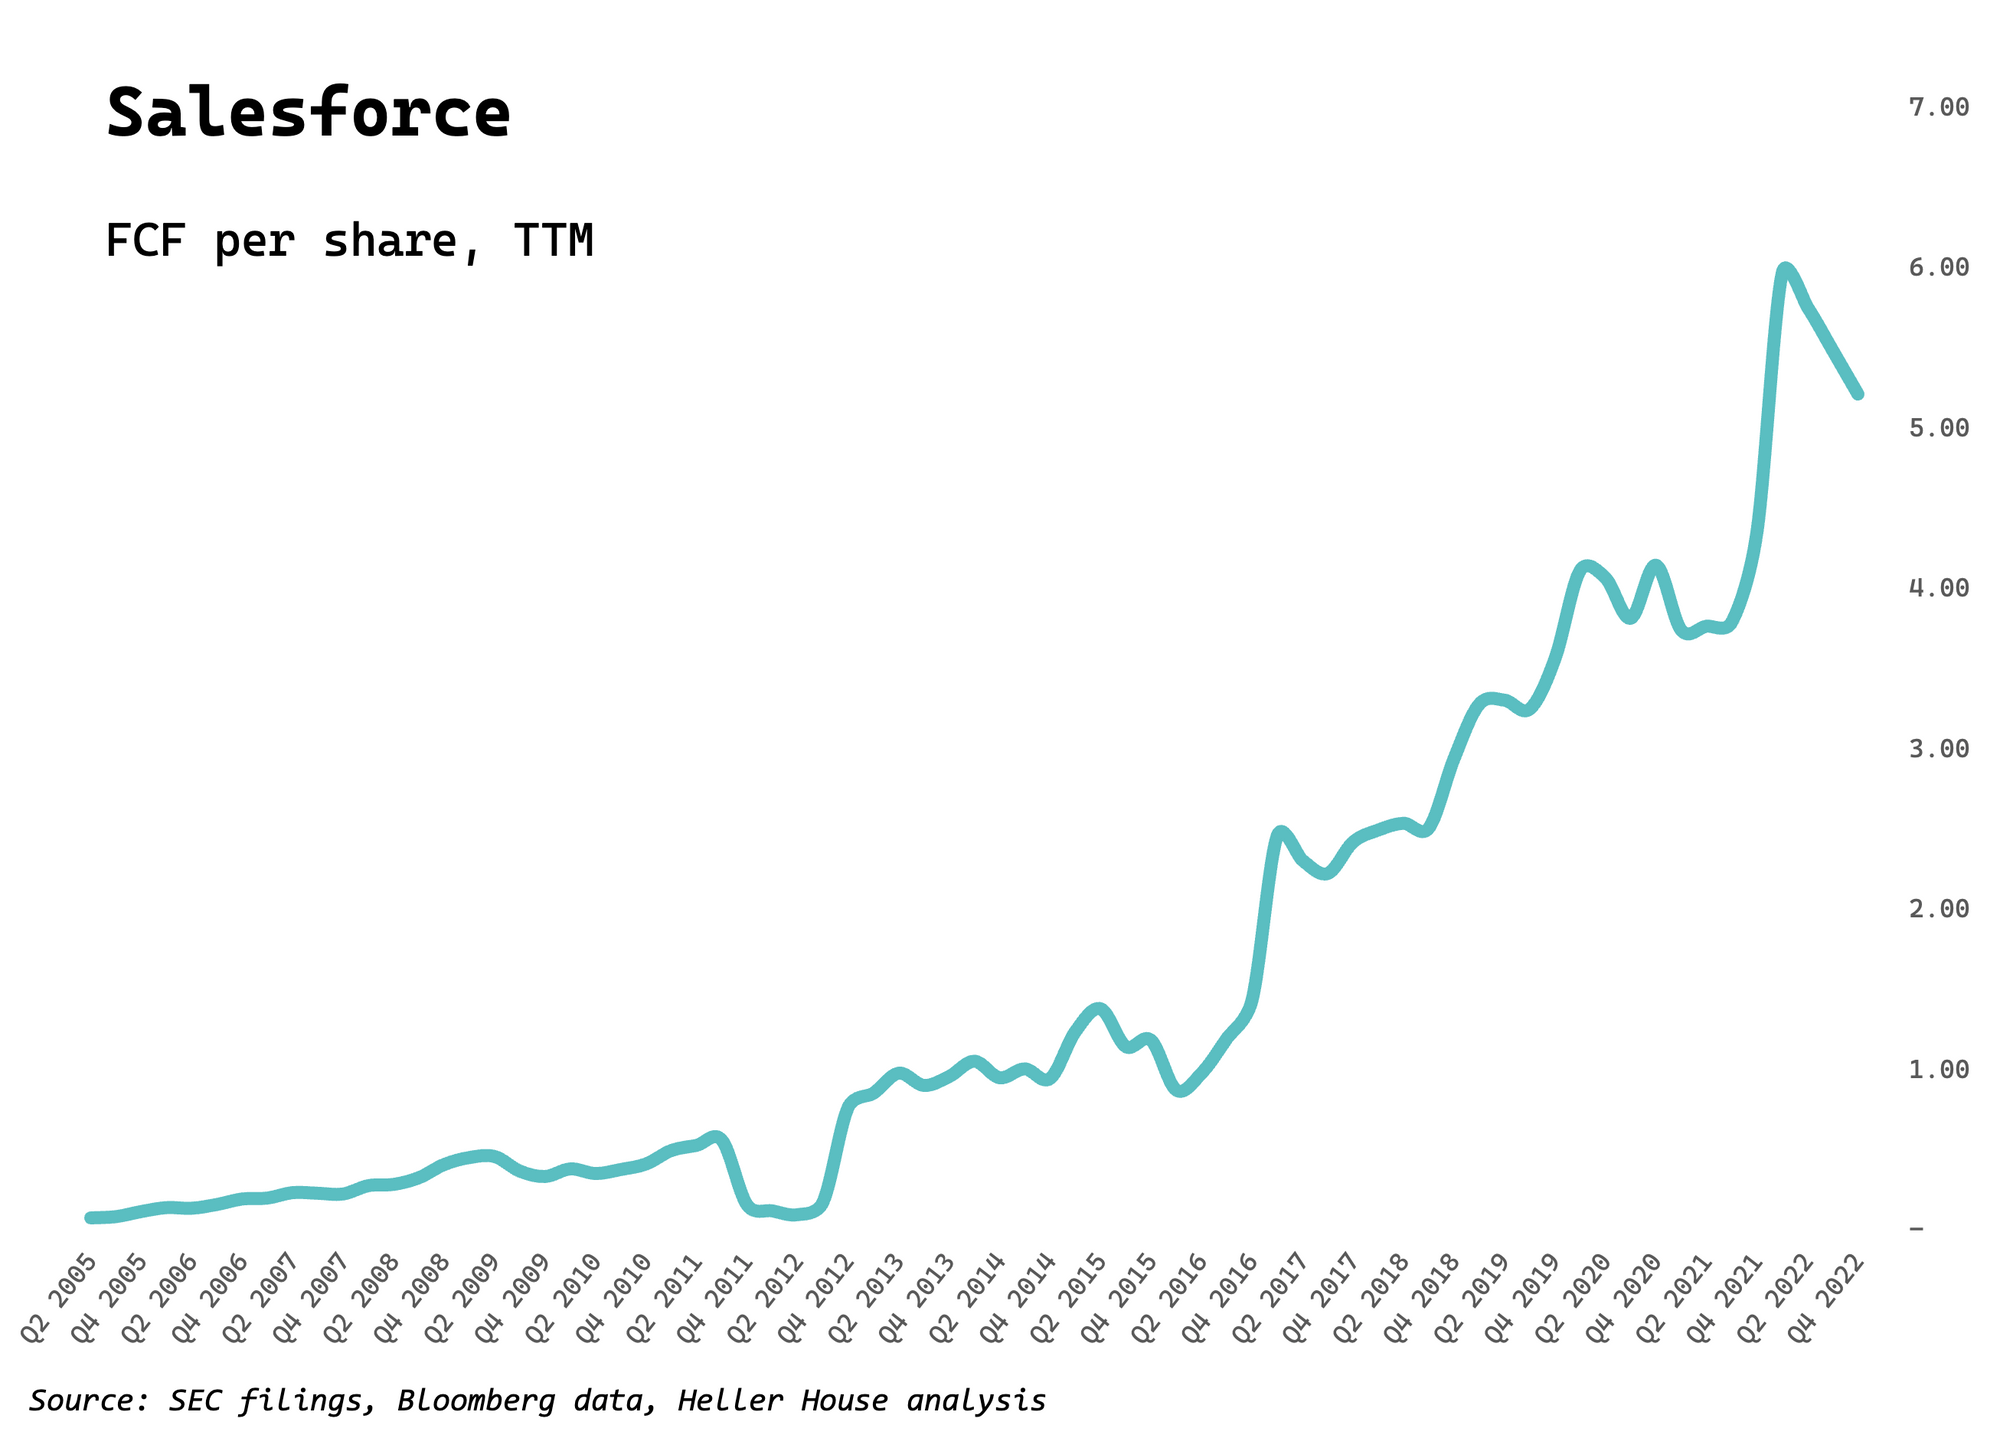
Perhaps this is because Salesforce’s free cash flow per share has compounded at 29 percent since the IPO, in-line with a 28 percent compounded growth in revenue per share.
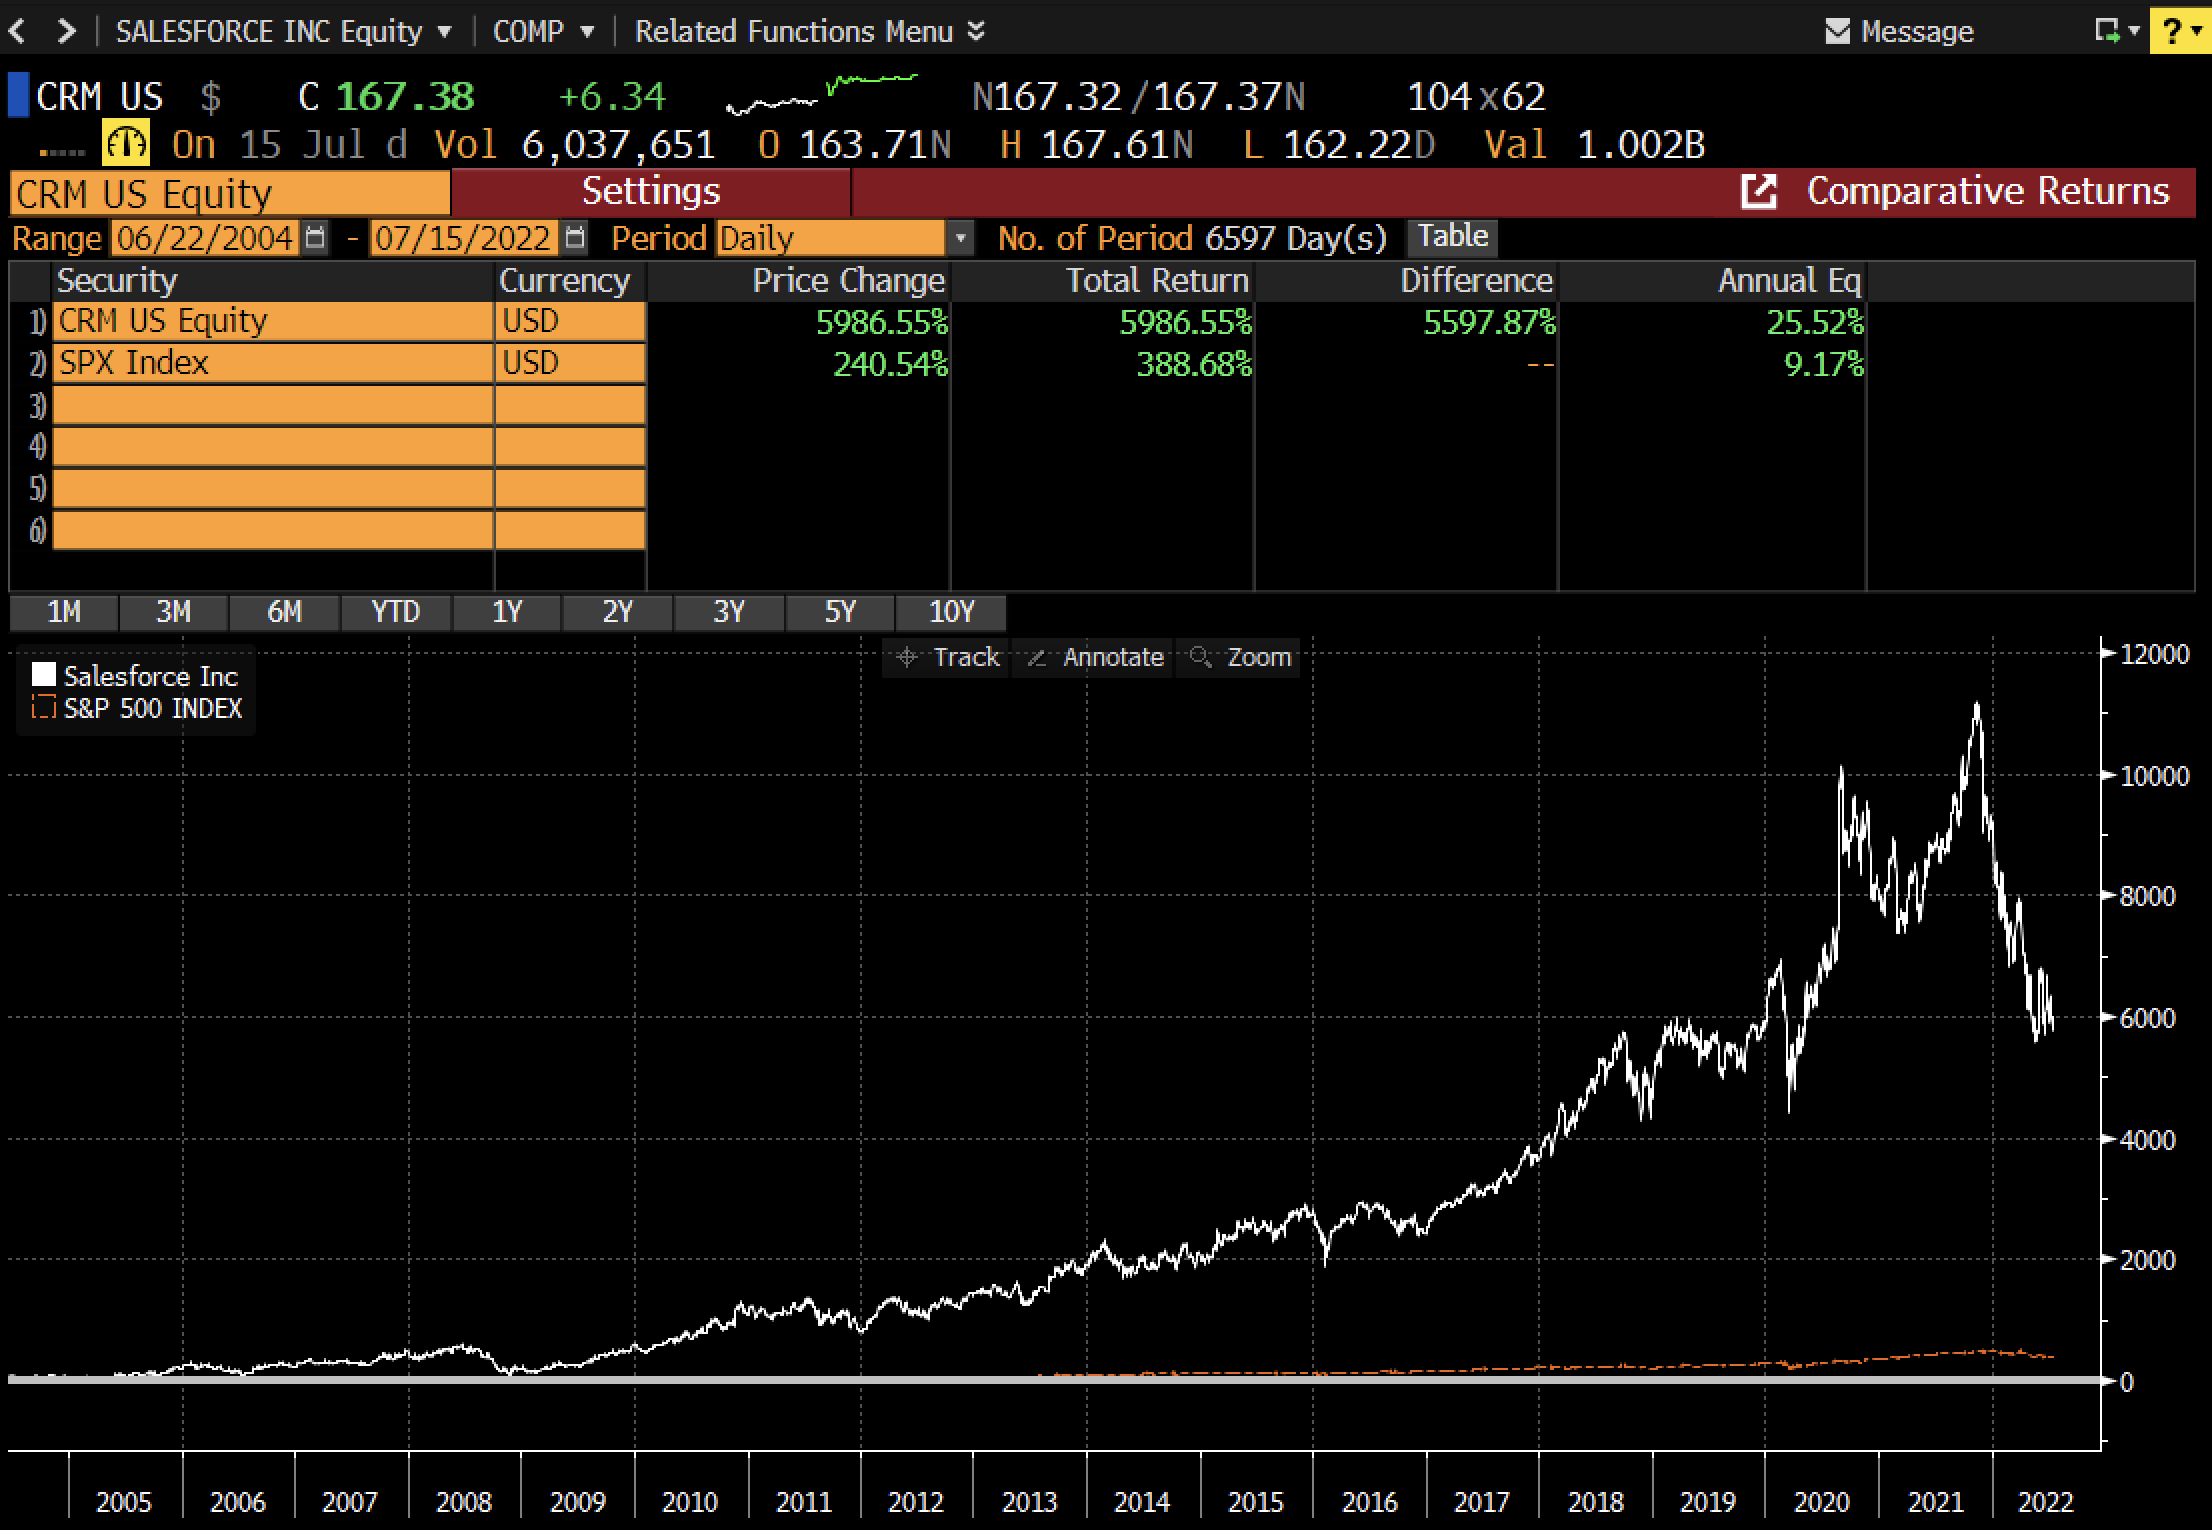
Since its IPO, Salesforce has handily beaten the S&P 500 index, with a total return of 5,987 percent compared with 389 percent for the index.
That’s cheating, you might say. Salesforce was undervalued at its IPO because few people understood the SaaS business model.
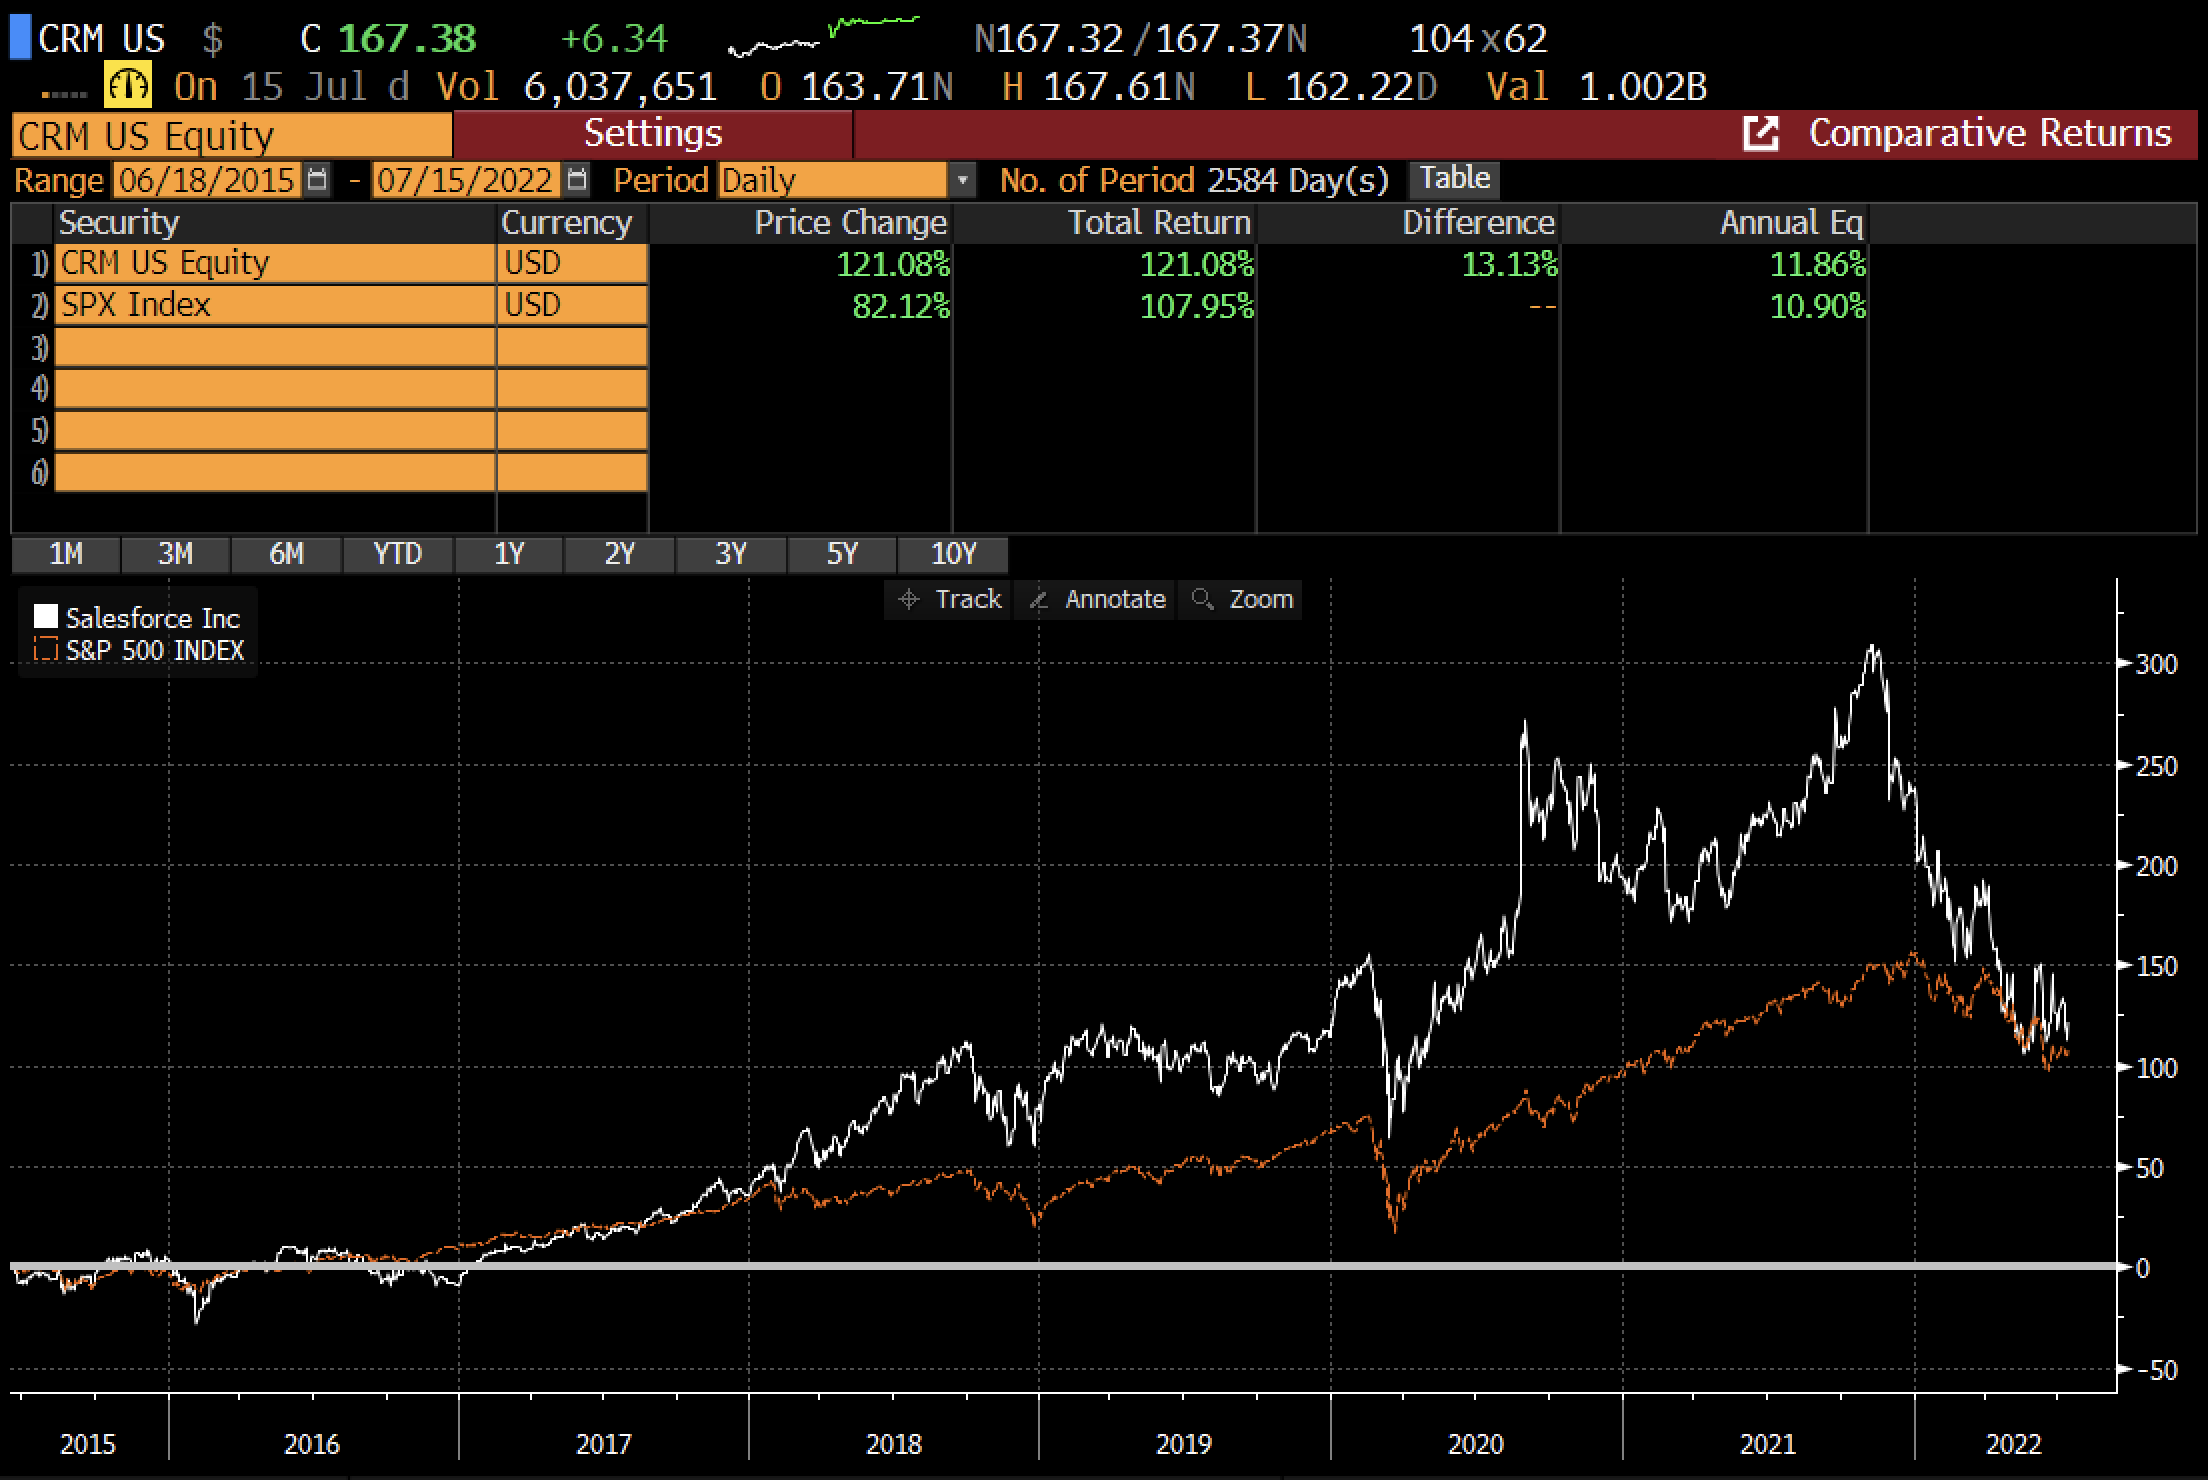
Suppose instead you invested at the peak valuation in 2015, when the stock hit 86x free cash flow (see the first chart). This was on June 18, 2015, when the stock nearly reached $76.
You would have still beaten the S&P 500 Index, with a total return of 121 percent, edging out the S&P 500’s 108 percent:
ServiceNow
Let’s look at another successful company with an even greater percentage of SBC in its free cashflows: ServiceNow.
As far back as I have data, to 2014, ServiceNow’s SBC add-back to free cash flow was a median of 84 percent every quarter; in the last two quarters it was 63 percent and 45 percent respectively.
Shares outstanding have grown at 4.8 percent compounded since mid-2013, although dilution has declined in recent quarters.
Despite persistent dilution, free cash flow per share grew 49 percent compounded since mid-2014.
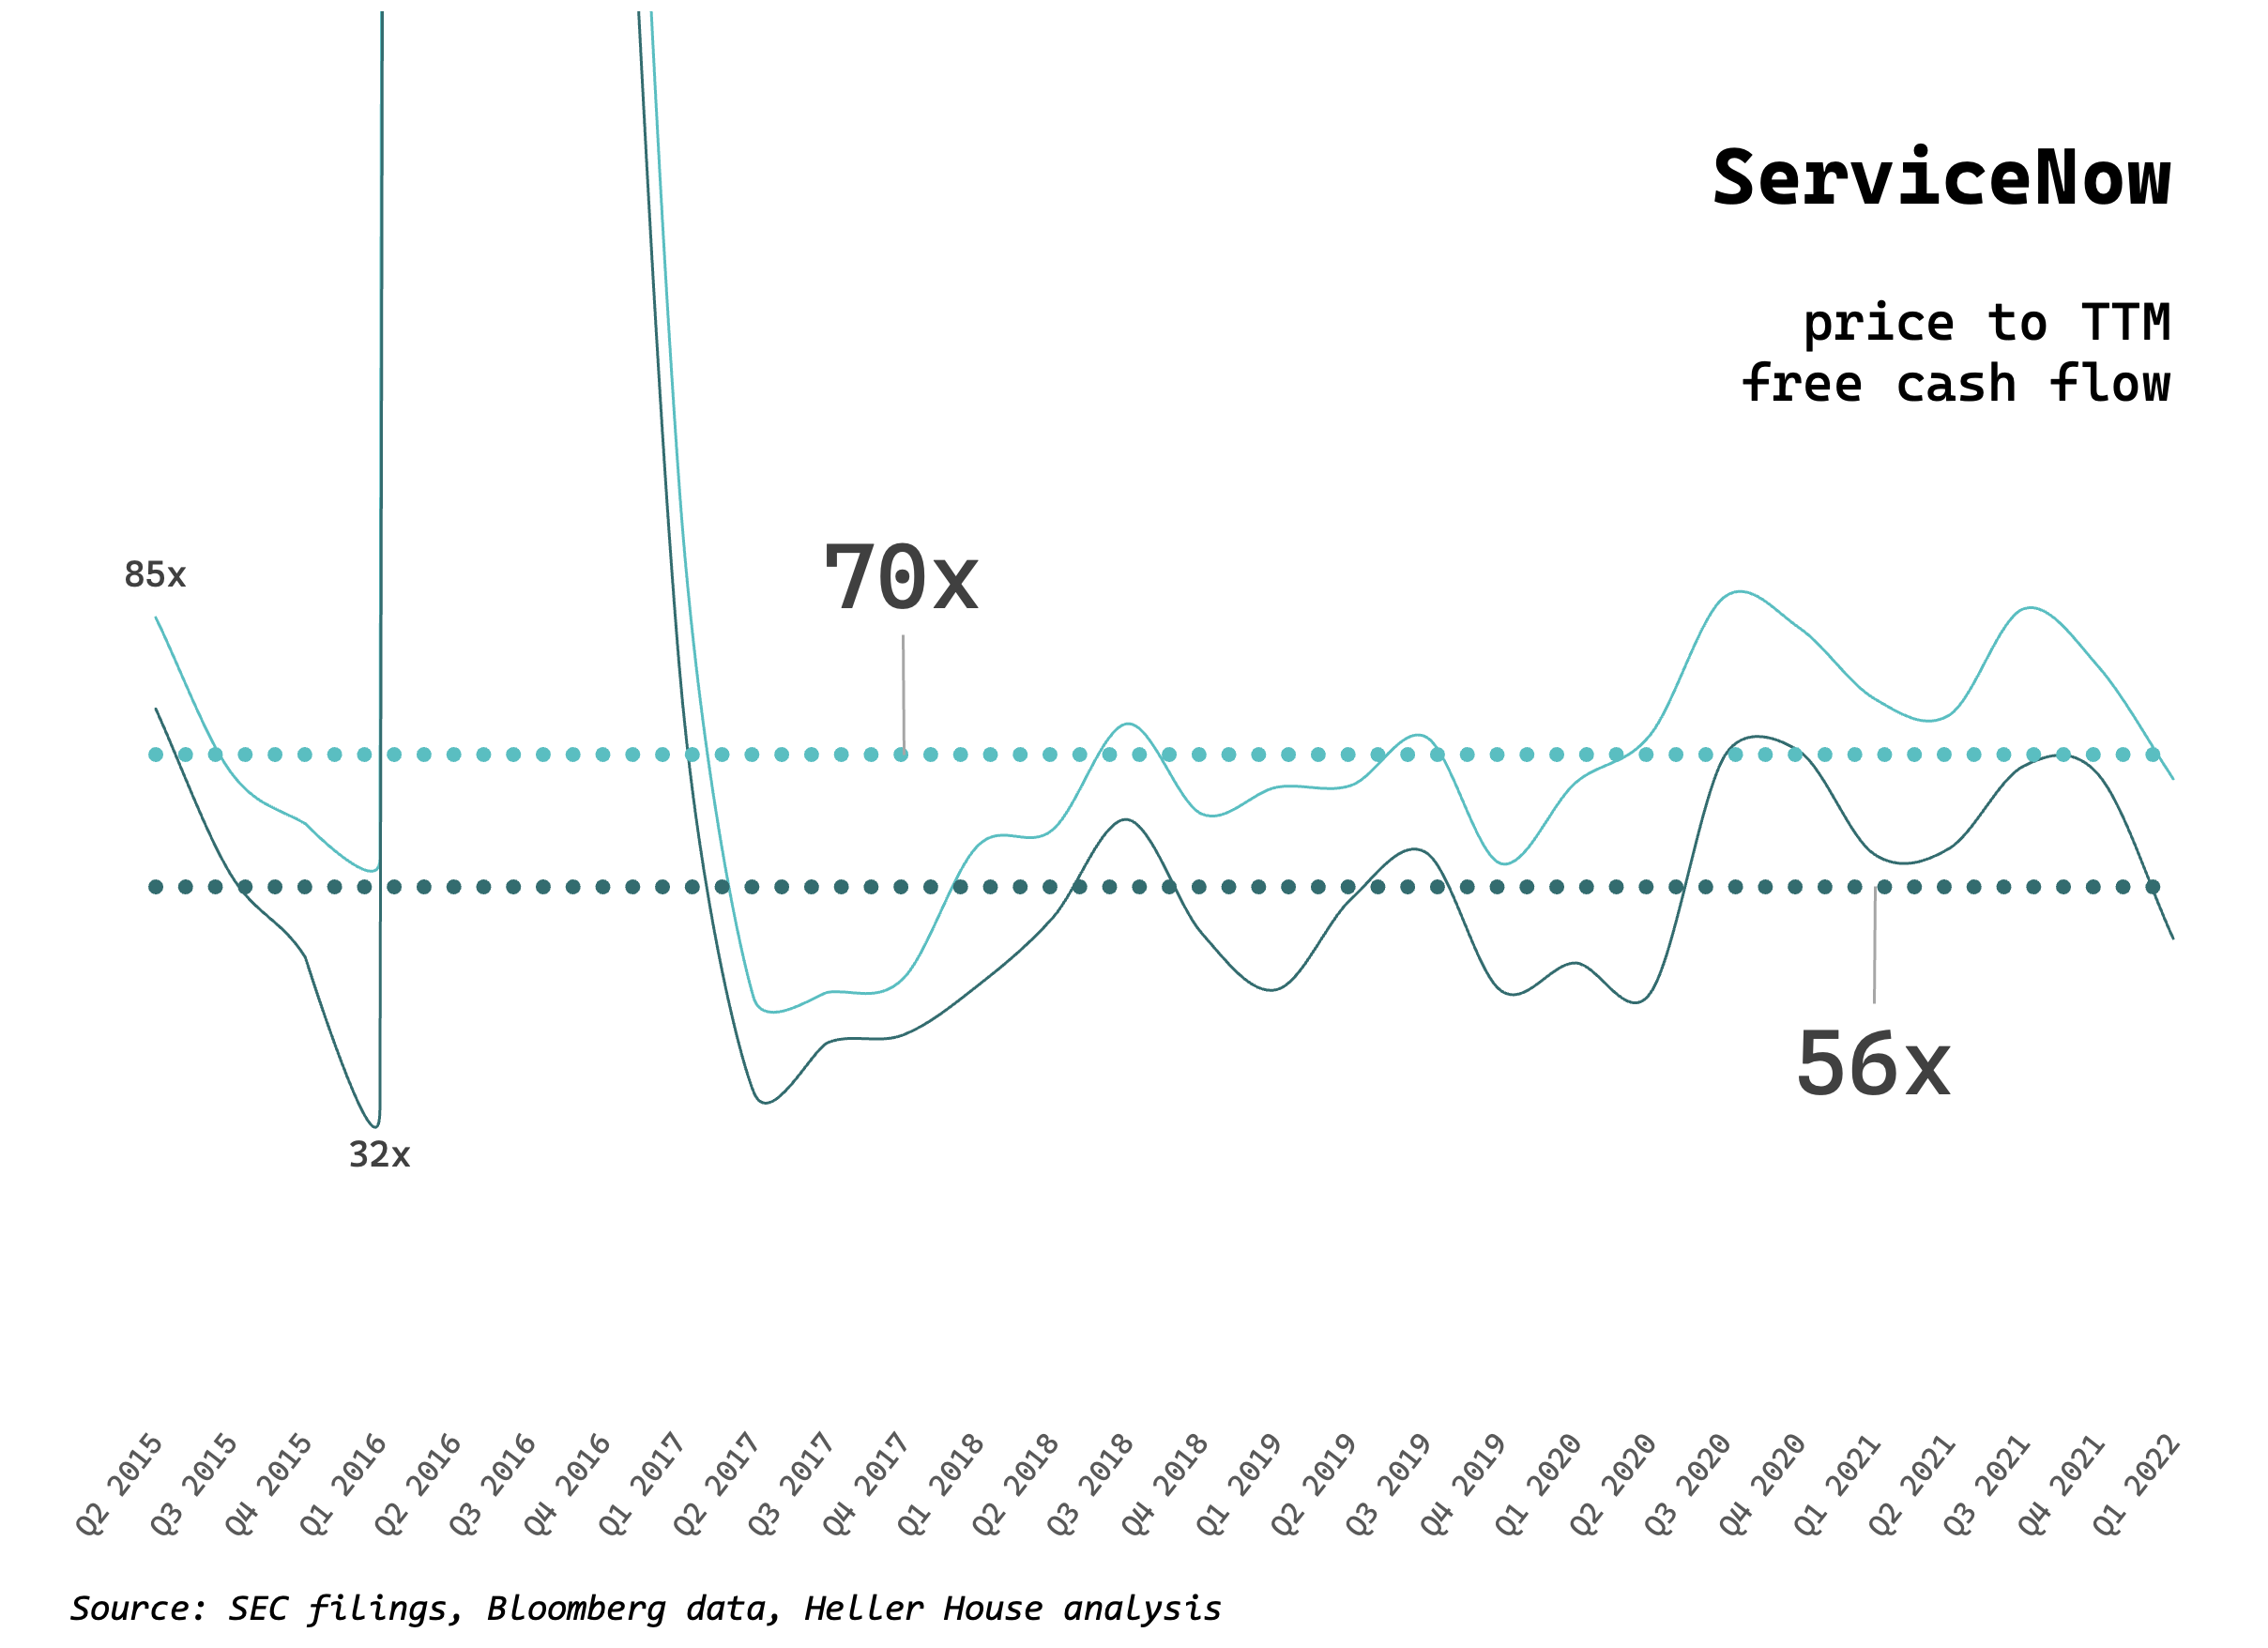
Commensurate with its higher growth rate, ServiceNow has traded at higher multiples, with a median high of 70x FCF and a median low of 56x:
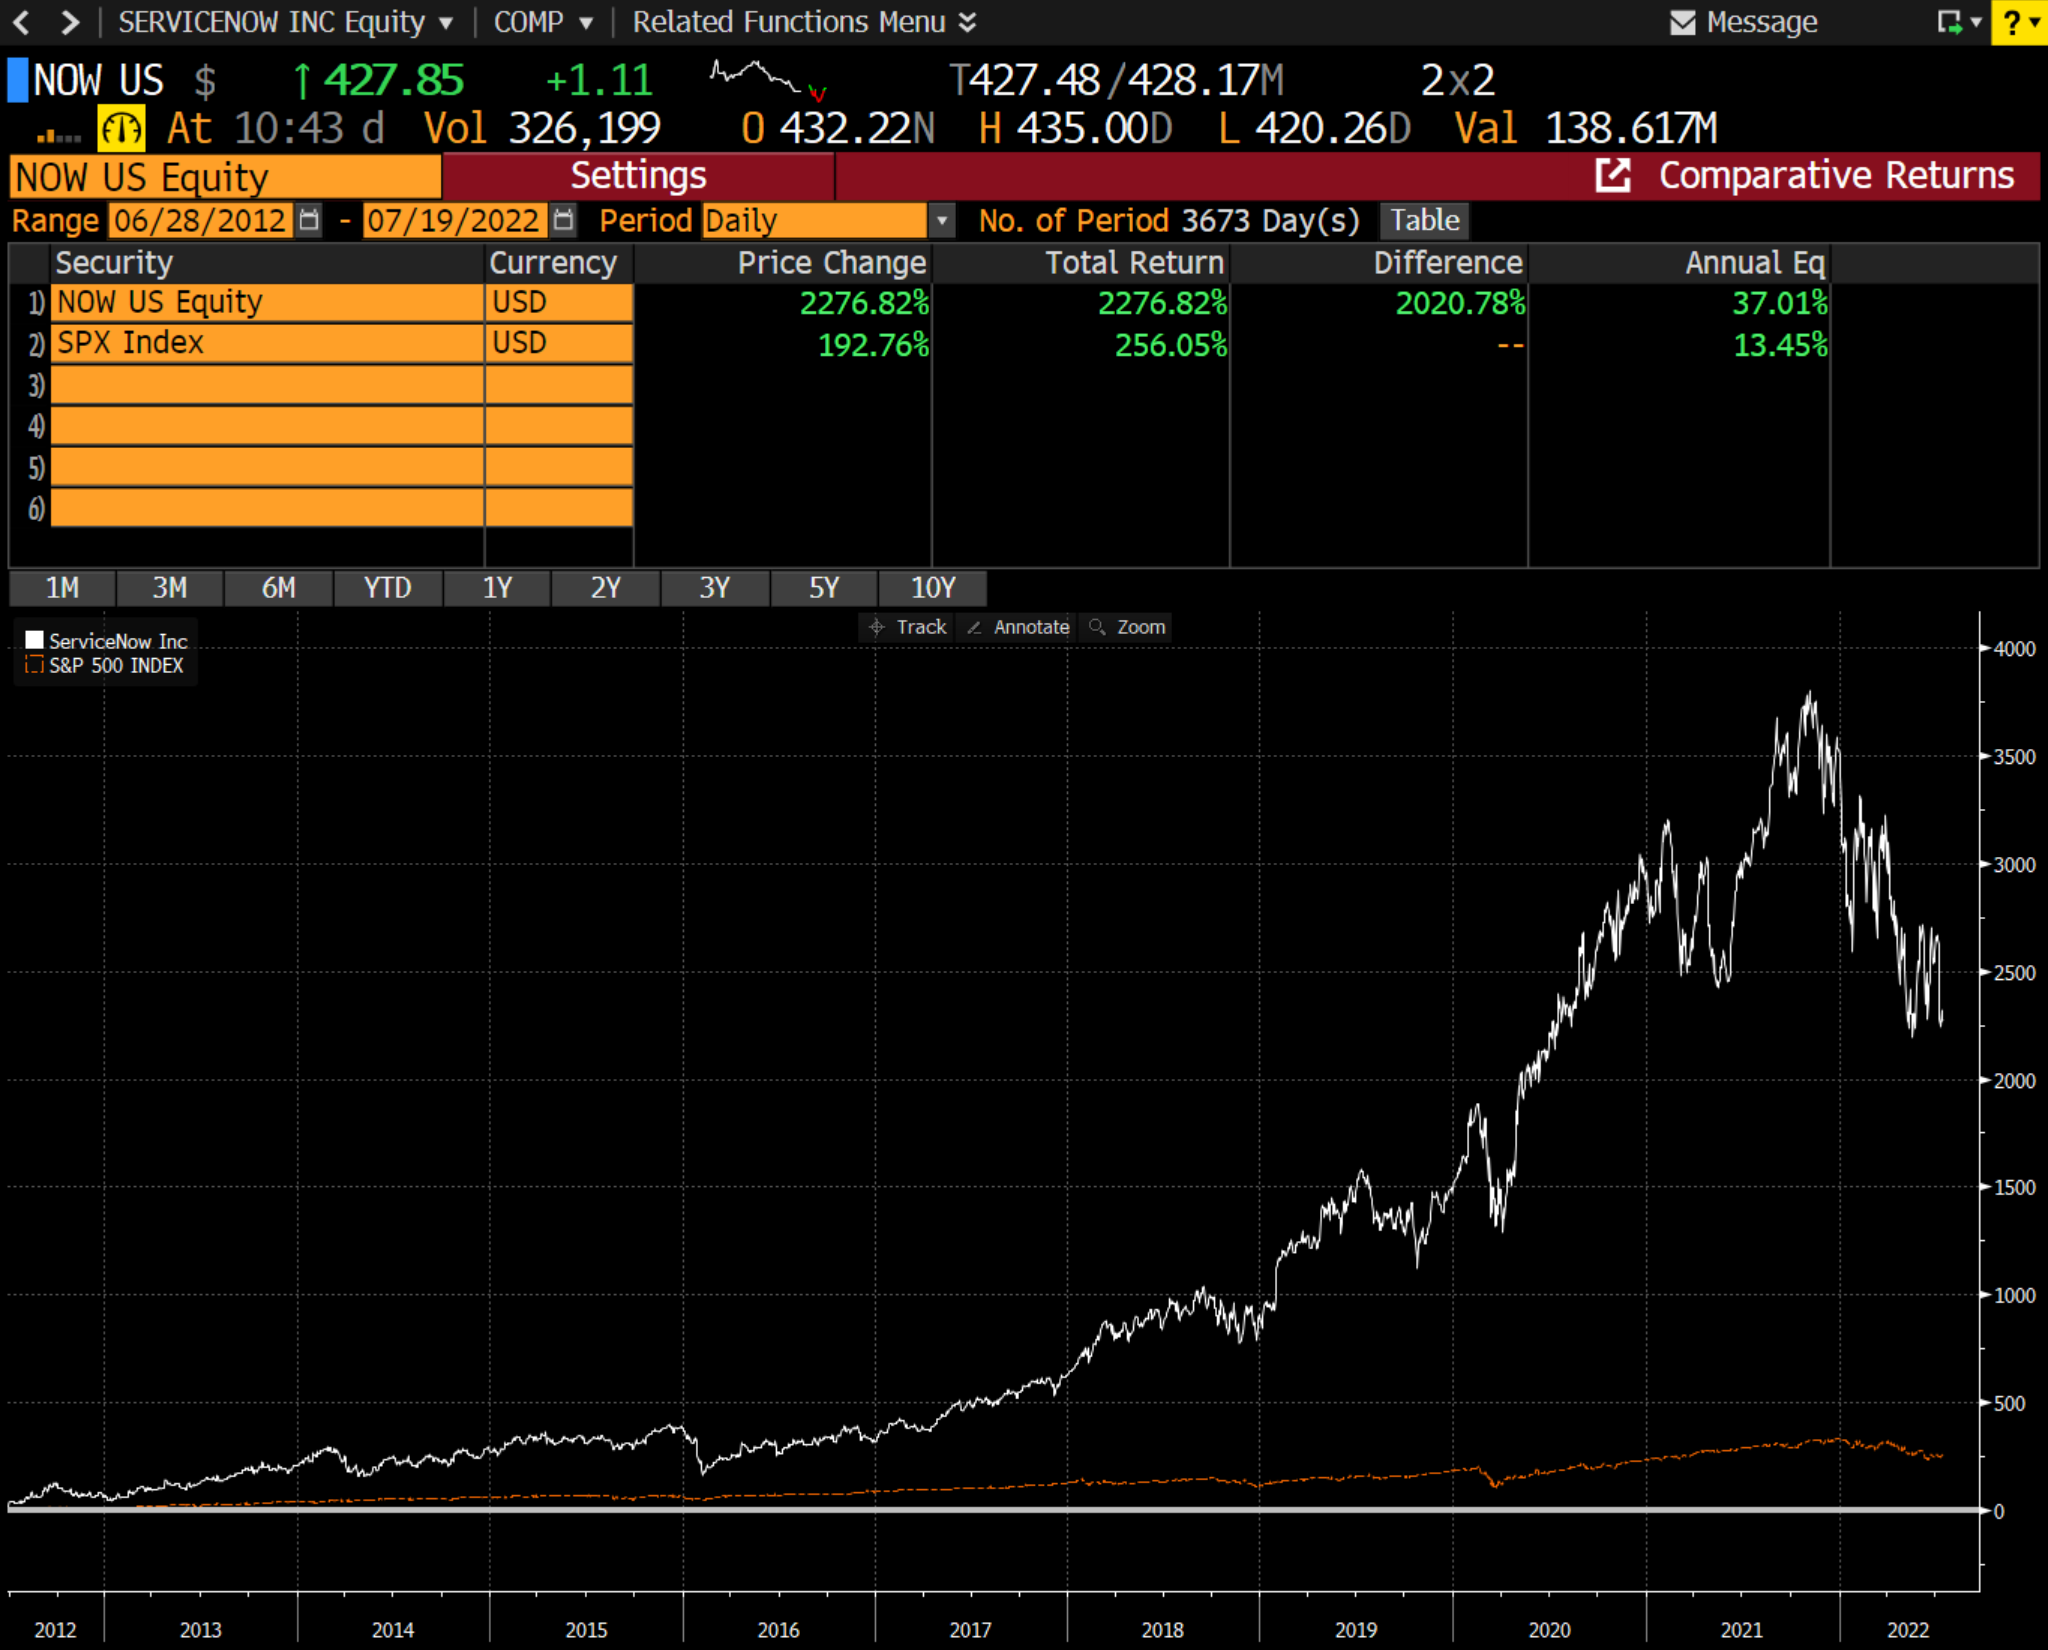
Since its IPO, ServiceNow has also crushed the S&P 500, with a total return of 2,277 percent compared with 256 percent for the index:
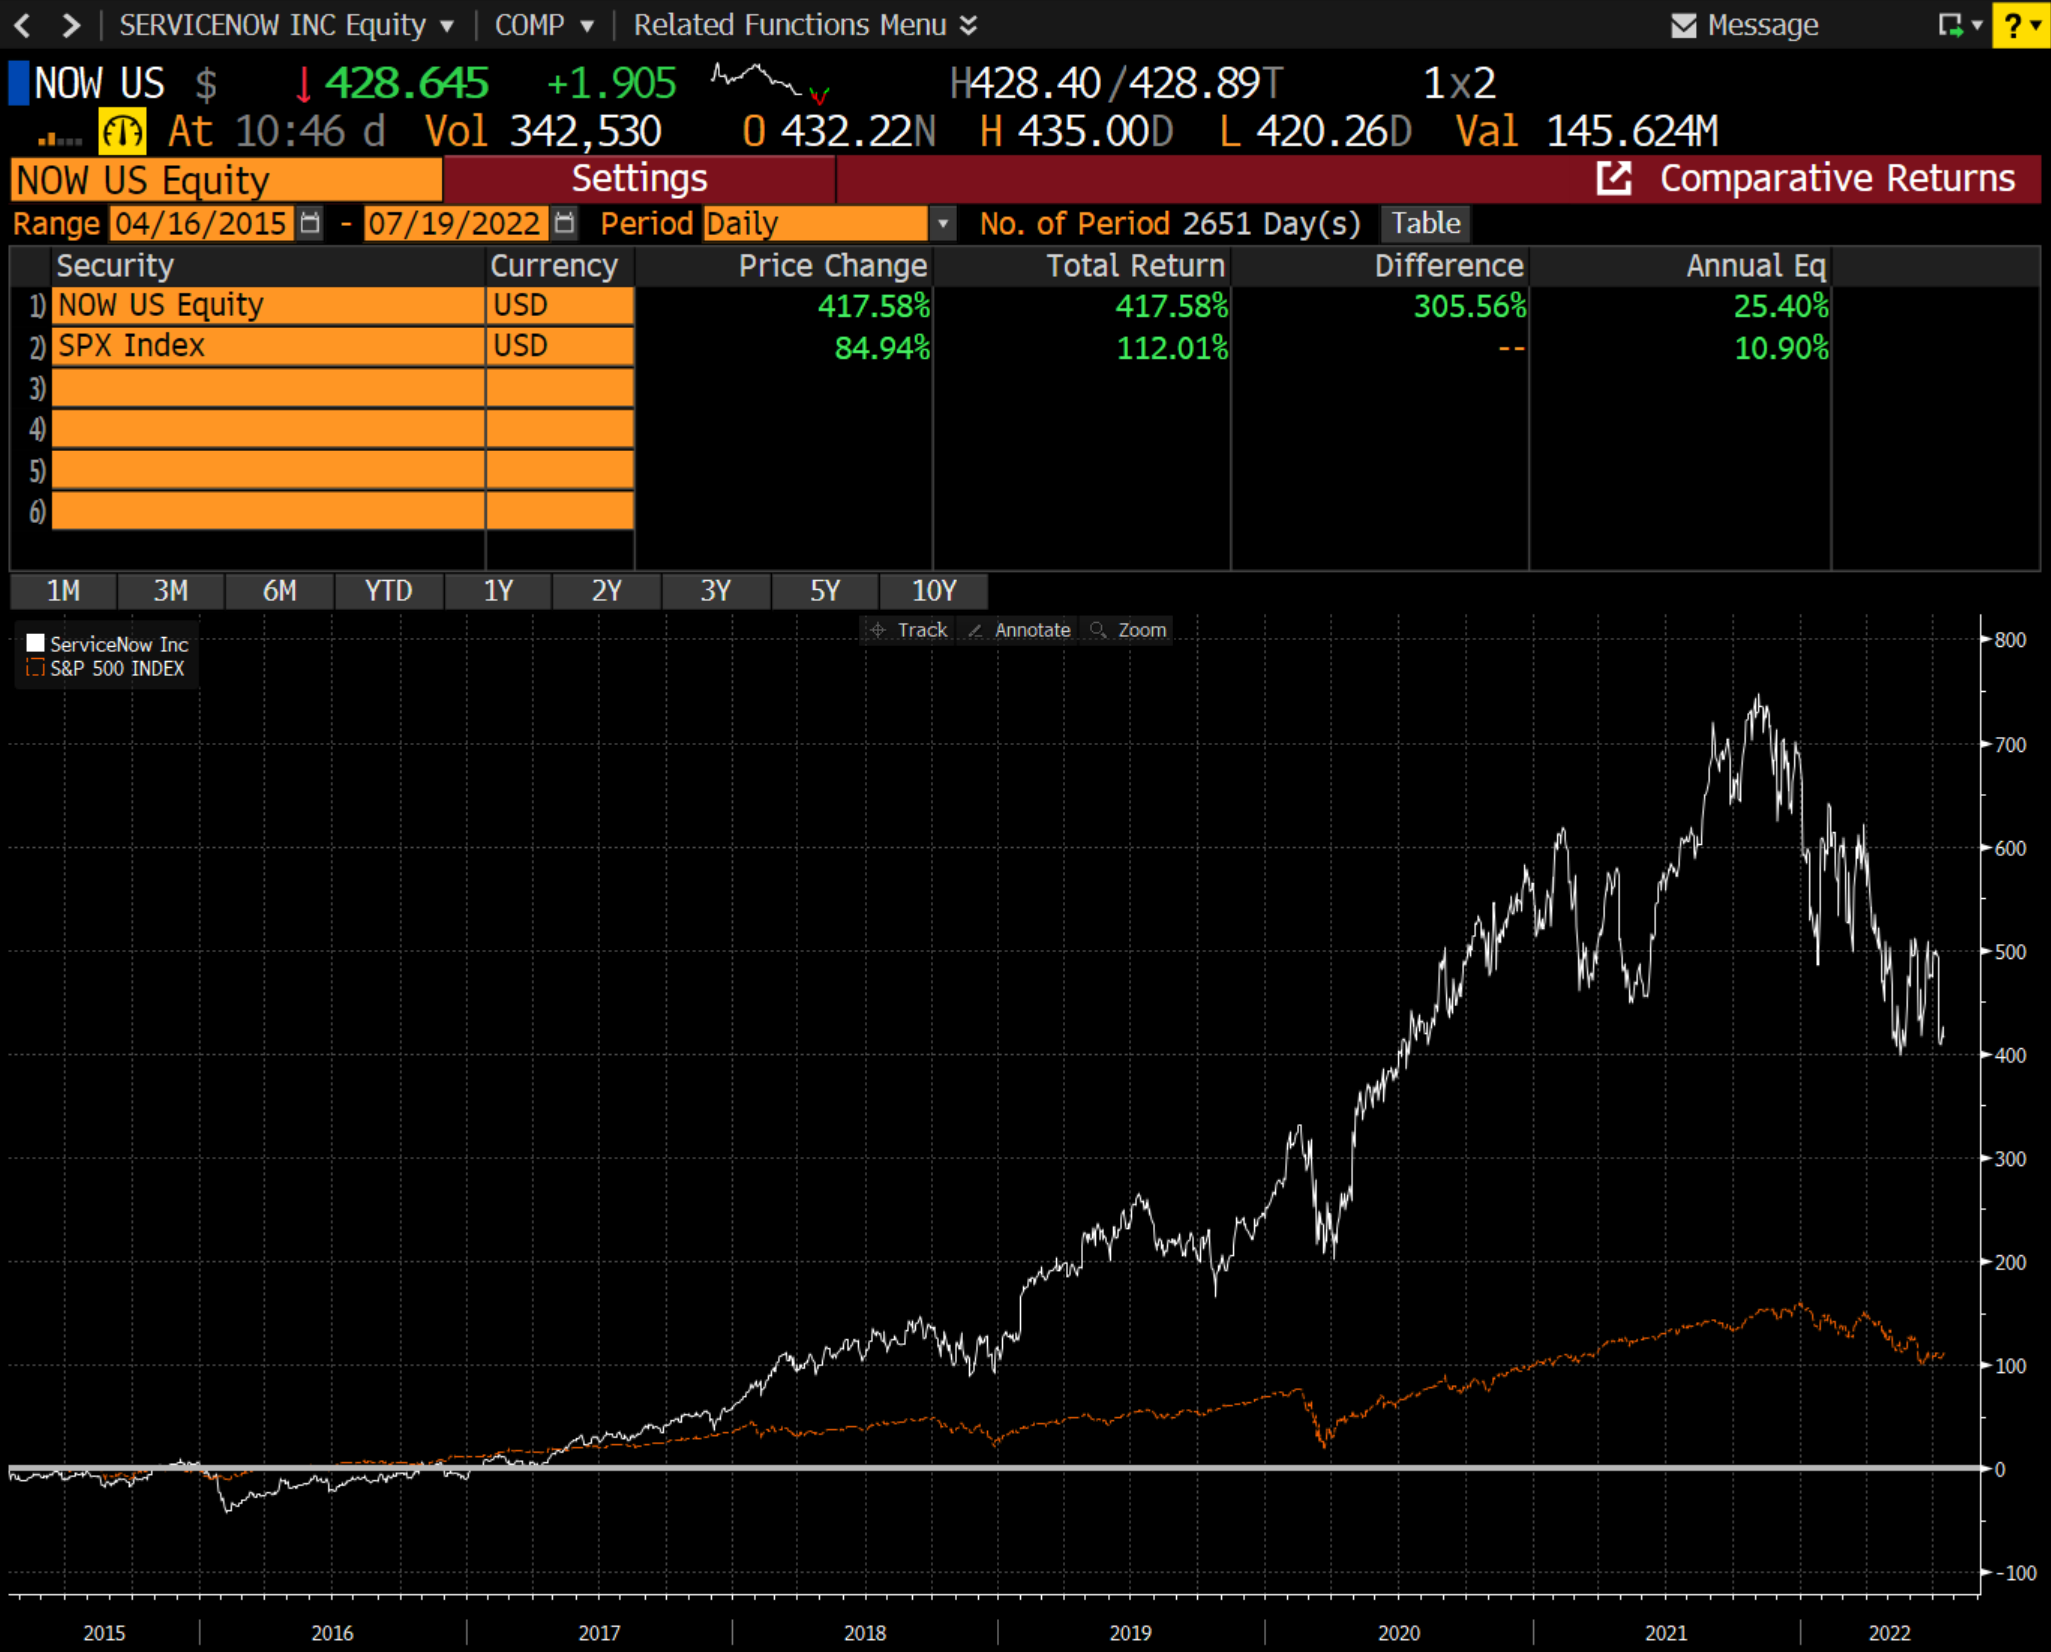
An investment at the peak multiple of 86x FCF in April 2015 would have still crushed the S&P 500: a 418 percent total return compared with 112 percent for the index:
Like Salesforce, ServiceNow sports rapid growth (around 30 percent in recent years) and high tangible ROIC (free cash flow of $2 billion against PP&E of $1.4 billion).
These two examples demonstrate that dilution and SBC add-backs may not matter as long as companies deliver on a per share basis.
It’s up to younger companies like Snowflake to demonstrate they can do just that.